Interaction to Next Paint is the Core Web Vital that tells you whether your site feels responsive after it loads. If Search Console flags INP issues, the cause is almost always JavaScript keeping the main thread busy when the user clicks, taps or types. This guide explains how to improve INP: what the metric measures, how to find the slow interactions, and the code patterns that fix them.
What INP measures
INP replaced First Input Delay as a Core Web Vital in March 2024. FID only measured the delay before the first interaction’s handler started. INP observes clicks, taps and key presses throughout the page’s lifetime and reports a value close to the worst one, ignoring a small number of outliers on pages with many interactions.
Each interaction’s latency has three parts:
- Input delay: time from the user’s action until event handlers start running, usually because the main thread is busy with other work.
- Processing duration: time spent running your event handlers.
- Presentation delay: time from handlers finishing until the browser paints the next frame, including style recalculation, layout and rendering.
Google’s thresholds, assessed at the 75th percentile of real page loads, are:
| Rating | INP |
|---|---|
| Good | 200 ms or less |
| Needs improvement | 200–500 ms |
| Poor | over 500 ms |
Knowing which of the three phases dominates tells you which fix to apply, so measure before you change anything.
Finding slow interactions in the field
CrUX and Search Console
The Chrome UX Report (CrUX) is the real-user data behind PageSpeed Insights and Search Console’s Core Web Vitals report. It tells you whether you have a problem and on which URL groups, but not which button causes it. Lab tools like Lighthouse can’t measure INP at all, because there is no user interacting; Total Blocking Time is a rough lab proxy.
Web Vitals JS with attribution
To find the actual element and phase, collect INP from real users with Google’s web-vitals library using its attribution build:
import { onINP } from 'web-vitals/attribution';

onINP(({ value, rating, attribution }) => {
  const {
    interactionTarget,   // CSS selector of the element
    interactionType,     // 'pointer' or 'keyboard'
    inputDelay,
    processingDuration,
    presentationDelay,
    longAnimationFrameEntries,
  } = attribution;

  navigator.sendBeacon('/api/vitals', JSON.stringify({
    metric: 'INP',
    value,
    rating,
    target: interactionTarget,
    type: interactionType,
    inputDelay,
    processingDuration,
    presentationDelay,
    page: location.pathname,
    // Script URLs responsible for long animation frames, if available
    scripts: longAnimationFrameEntries
      ?.flatMap((e) => e.scripts.map((s) => s.sourceURL))
      .slice(0, 5),
  }));
});
Aggregate by target and you get a ranked list of the interactions worth fixing. The attribution fields have changed between major versions of the library, so check the README for the version you install.
Chrome DevTools
Once you know the element, reproduce the interaction in the DevTools Performance panel. Recent versions of Chrome show live INP and a log of interactions as you click around, and a recording breaks each interaction into its phases. Enable CPU throttling (4x or 6x) to approximate mid-range phones, because many real users are on much slower devices than your development machine.
Break up long tasks
A long task is any main-thread task over 50 ms. While it runs, the browser can’t respond to input or paint. The most effective INP fix is splitting long tasks so the browser gets regular chances to handle input and render.
Yield to the main thread
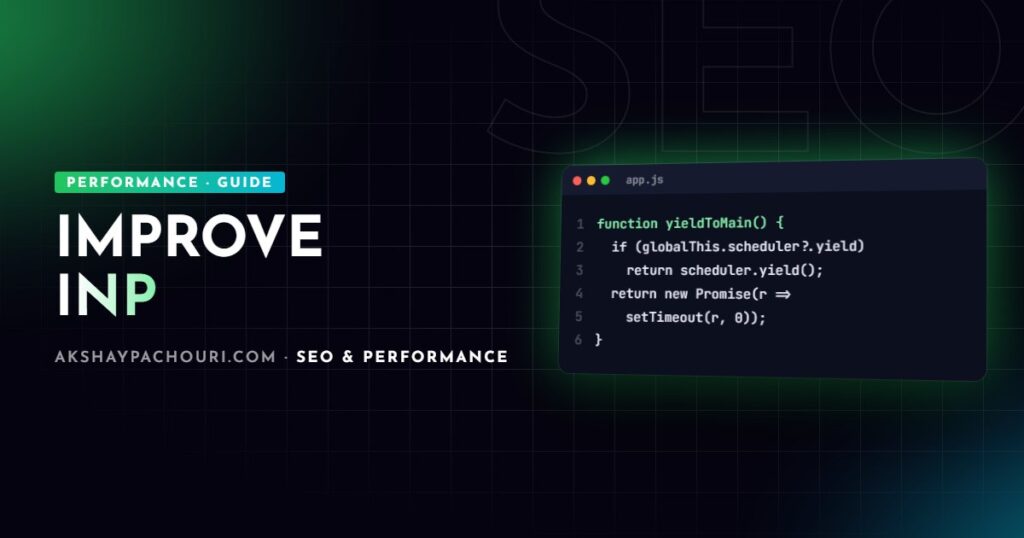
scheduler.yield() pauses your function, lets the browser handle pending work, then resumes your continuation ahead of other queued tasks. It is not available in every browser yet, so use a fallback:
function yieldToMain() {
  if (globalThis.scheduler?.yield) {
    return scheduler.yield();
  }
  // Fallback: new macrotask, lets the browser handle input and paint
  return new Promise((resolve) => setTimeout(resolve, 0));
}

async function processItems(items) {
  let lastYield = performance.now();

  for (const item of items) {
    processItem(item);

    // Yield roughly every 50 ms instead of after every item
    if (performance.now() - lastYield > 50) {
      await yieldToMain();
      lastYield = performance.now();
    }
  }
}
Paint first, then do the rest
Handlers often do two things: update the UI and run follow-up work like analytics, saving state or recalculating something off-screen. Do the visual update first, yield, then do the rest, so the next paint isn’t blocked by work the user can’t see.
filterButton.addEventListener('click', async () => {
  // 1. Immediate visual feedback
  filterButton.setAttribute('aria-pressed', 'true');
  resultsEl.classList.add('is-loading');

  // 2. Let the browser paint that feedback
  await yieldToMain();

  // 3. Heavier work afterwards
  const results = applyFilters(allProducts, getActiveFilters());
  renderResults(results);
  trackEvent('filter_applied');
});
In React, startTransition and useTransition mark state updates as non-urgent so React can keep the input responsive while rendering the expensive part. Reducing unnecessary re-renders helps too; my React re-render optimisation guide covers that side.
Move heavy computation off the main thread
Parsing large JSON, filtering big datasets or image processing can run in a Web Worker, leaving the main thread free to respond. Workers can’t touch the DOM, so send data in and results out.
Reduce input delay
High input delay means something else was running when the user interacted. Typical sources:
- Hydration and startup JavaScript during the first seconds after load. Ship less JavaScript, code-split routes and defer non-critical components.
- Timers and intervals such as carousels, polling and scroll-linked work running continuously.
- Large bundles evaluated at once. Load rarely used features with dynamic
import()when needed. - Scroll and touch handlers doing work on every event. Mark them
{ passive: true }and throttle withrequestAnimationFrame.
// Load the heavy date picker only when the user opens it
dateField.addEventListener('focus', async () => {
  const { initDatePicker } = await import('./date-picker.js');
  initDatePicker(dateField);
}, { once: true });
Avoid layout thrashing and expensive rendering
Presentation delay grows when the browser has a lot of style and layout work after your handler. The worst pattern is layout thrashing: alternating DOM reads and writes in a loop, which forces synchronous layout on every iteration.
// Bad: read, write, read, write… forces layout each iteration
cards.forEach((card) => {
  const h = card.offsetHeight;      // read (forces layout)
  card.style.height = h + 10 + 'px'; // write (invalidates layout)
});

// Good: batch all reads, then all writes
const heights = cards.map((card) => card.offsetHeight);
cards.forEach((card, i) => {
  card.style.height = heights[i] + 10 + 'px';
});
Other presentation-delay fixes:
- Keep the DOM smaller. Very large pages make every style recalculation and layout slower.
- Use
content-visibility: autoon long off-screen sections so the browser can skip rendering them. - Prefer
transformandopacityfor animations, which avoid layout. - Avoid rendering huge lists in one go; virtualise them.
.product-section {
  content-visibility: auto;
  contain-intrinsic-size: auto 800px; /* estimated height to avoid scroll jumps */
}
Tame third-party scripts
Tag managers, chat widgets, A/B testing tools, consent platforms and ad scripts all compete for the same main thread. They often add their own click listeners that run alongside yours. The longAnimationFrameEntries attribution data shows script URLs, which makes third-party culprits easy to spot.
- Audit the tag manager. Remove tags nobody uses and fire the rest on specific triggers rather than every click.
- Load chat widgets on demand: show a lightweight button and inject the real widget when clicked.
- Load non-essential scripts with
deferor after the page is idle. - Consider moving analytics and tag scripts to a worker-based approach such as Partytown, testing carefully since not every script works there.
// Inject the chat widget only on first click
document.querySelector('#chat-launcher').addEventListener('click', () => {
  const s = document.createElement('script');
  s.src = 'https://chat.example.com/widget.js';
  s.async = true;
  document.head.appendChild(s);
}, { once: true });
On WordPress sites, plugins are usually the biggest third-party source; my WordPress Core Web Vitals checklist covers trimming them.
Key takeaways
- INP measures the latency of interactions across the whole visit; good is 200 ms or less at the 75th percentile.
- Use CrUX to confirm the problem and
web-vitals/attributionto find the exact element and phase. - Break long tasks with
scheduler.yield()and asetTimeoutfallback, and paint feedback before doing heavier work. - Reduce input delay by shipping and evaluating less JavaScript up front.
- Batch DOM reads and writes and shrink rendering work to cut presentation delay.
- Audit and lazy-load third-party scripts; they are often the hidden cause.
Frequently asked questions
Why is my INP poor when Lighthouse shows a good score?
Lighthouse runs without user interaction, so it cannot measure INP. Your field INP comes from real users on real devices, which are often much slower than your test machine.
Does scheduler.yield() work in all browsers?
Support is still not universal, so feature-detect it and fall back to a setTimeout-based promise. The fallback still lets the browser handle input and paint, but your continuation may run after other queued tasks.
How long does it take for INP improvements to show in Search Console?
Search Console uses a rolling 28-day window of CrUX data, so improvements appear gradually over about four weeks. Your own web-vitals monitoring will show changes much sooner.
Do scroll events count toward INP?
No, scrolling and hovering are not counted as interactions for INP. However, heavy scroll handlers can keep the main thread busy and increase input delay for the next click or tap.
If your site is failing INP and you need someone to track down the slow interactions and fix them, contact me for a performance audit.